How Urban Farming Improves Your GRESB Score
Learn how on-site urban farms strengthen your GRESB sustainability reporting — which indicators they support, and how property managers earn the points.
Quick answer: Urban farms contribute to GRESB sustainability reporting primarily through the assessment's biodiversity, social, and stakeholder-engagement indicators. By adding measurable green space, on-site food production and tenant programming, a property generates documented evidence for several GRESB performance criteria — the same data that strengthens year-over-year benchmark improvement.
For property managers and sustainability officers, GRESB sustainability reporting is one of the few places where a physical, on-the-ground intervention translates directly into a benchmark score that investors actually read. An on-site farm is one of the clearest examples: it is visible, measurable, and it produces evidence across multiple indicators at once. This guide breaks down exactly where urban farming fits in the GRESB framework, which indicators it supports, how to document the contribution defensibly, and what credible improvement looks like over a reporting cycle. For the wider strategy, see our pillar guide to ESG-aligned urban farming.

What GRESB measures — and where urban farming fits
GRESB measures the ESG performance of real estate portfolios and assets against a standardized, peer-benchmarked framework, scoring participants on Management and Performance components built from weighted indicators. GRESB describes itself as the global ESG benchmark for real assets, and its annual assessment is used by institutional investors to compare funds and properties on a like-for-like basis. Urban farming fits inside the Performance component, where indicators reward documented action on biodiversity, building-level health and wellbeing, community impact, and tenant or stakeholder engagement — all areas an operating farm touches directly.
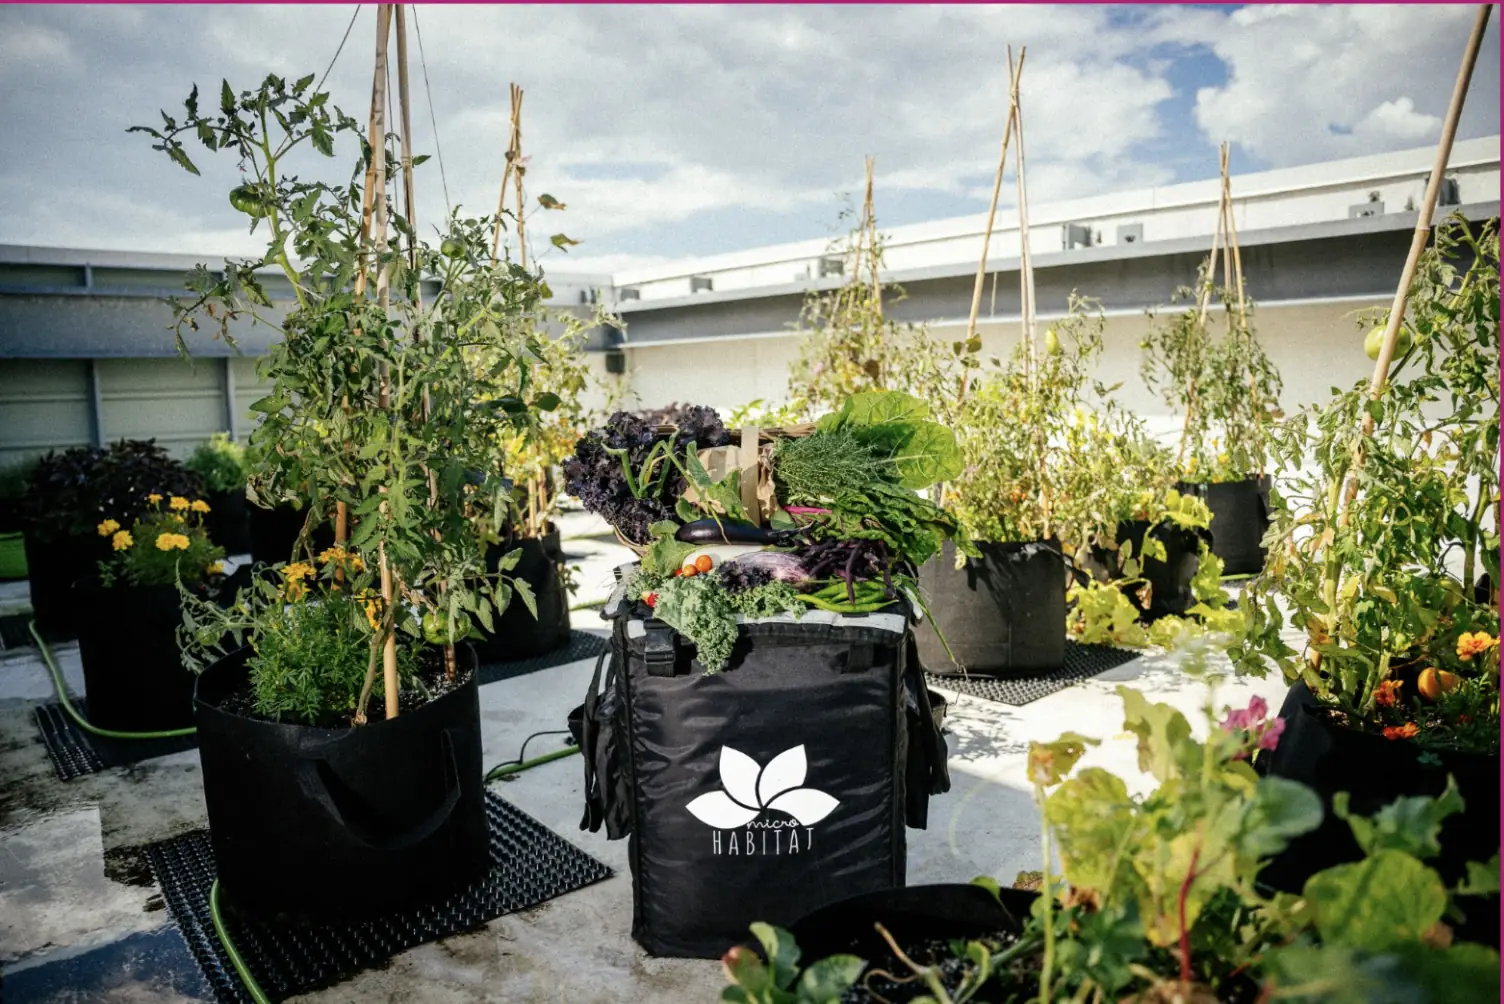
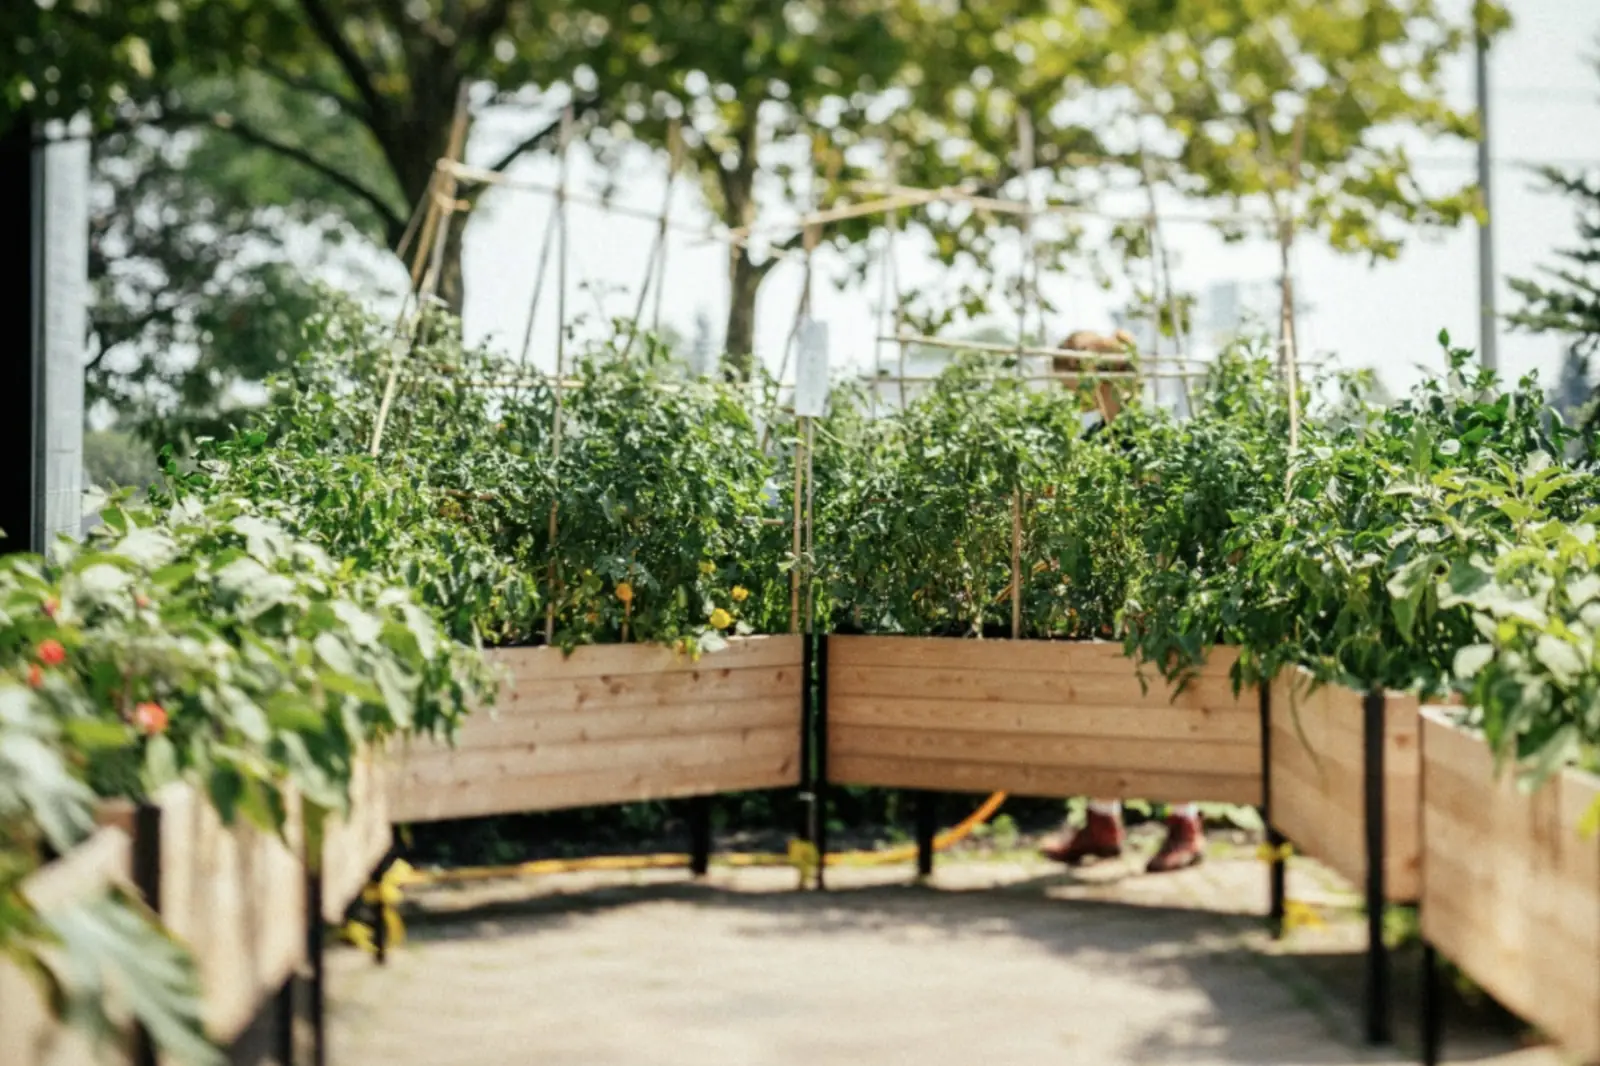
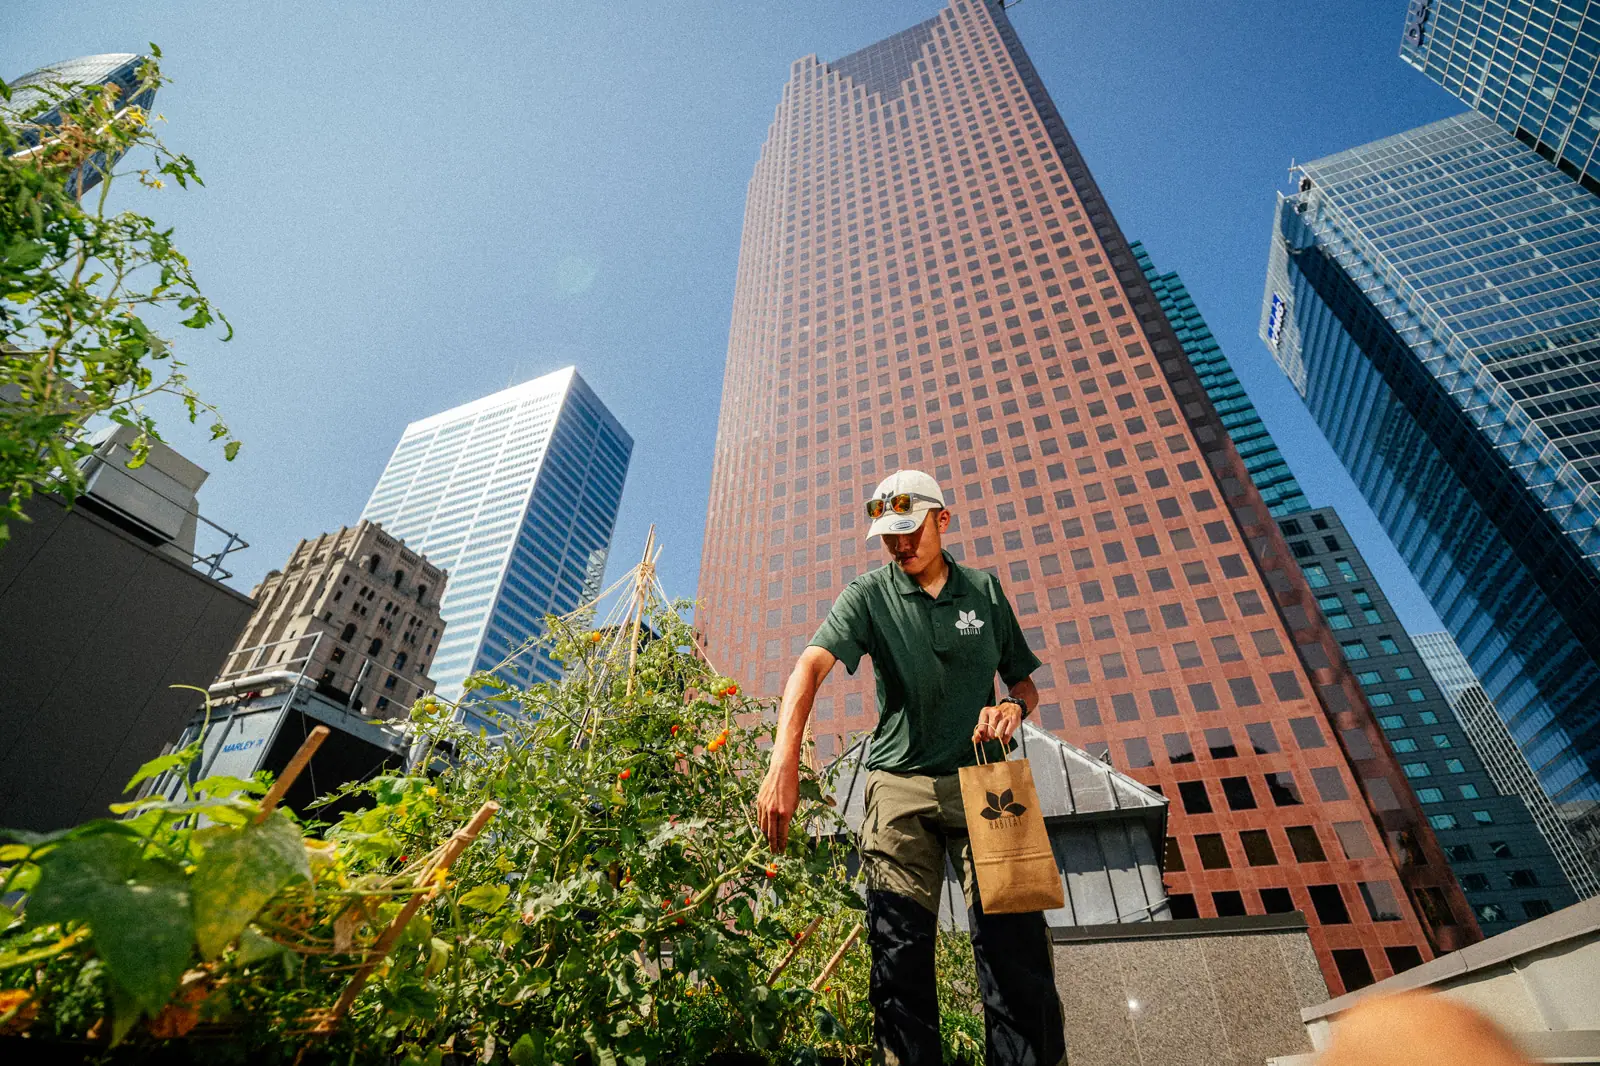
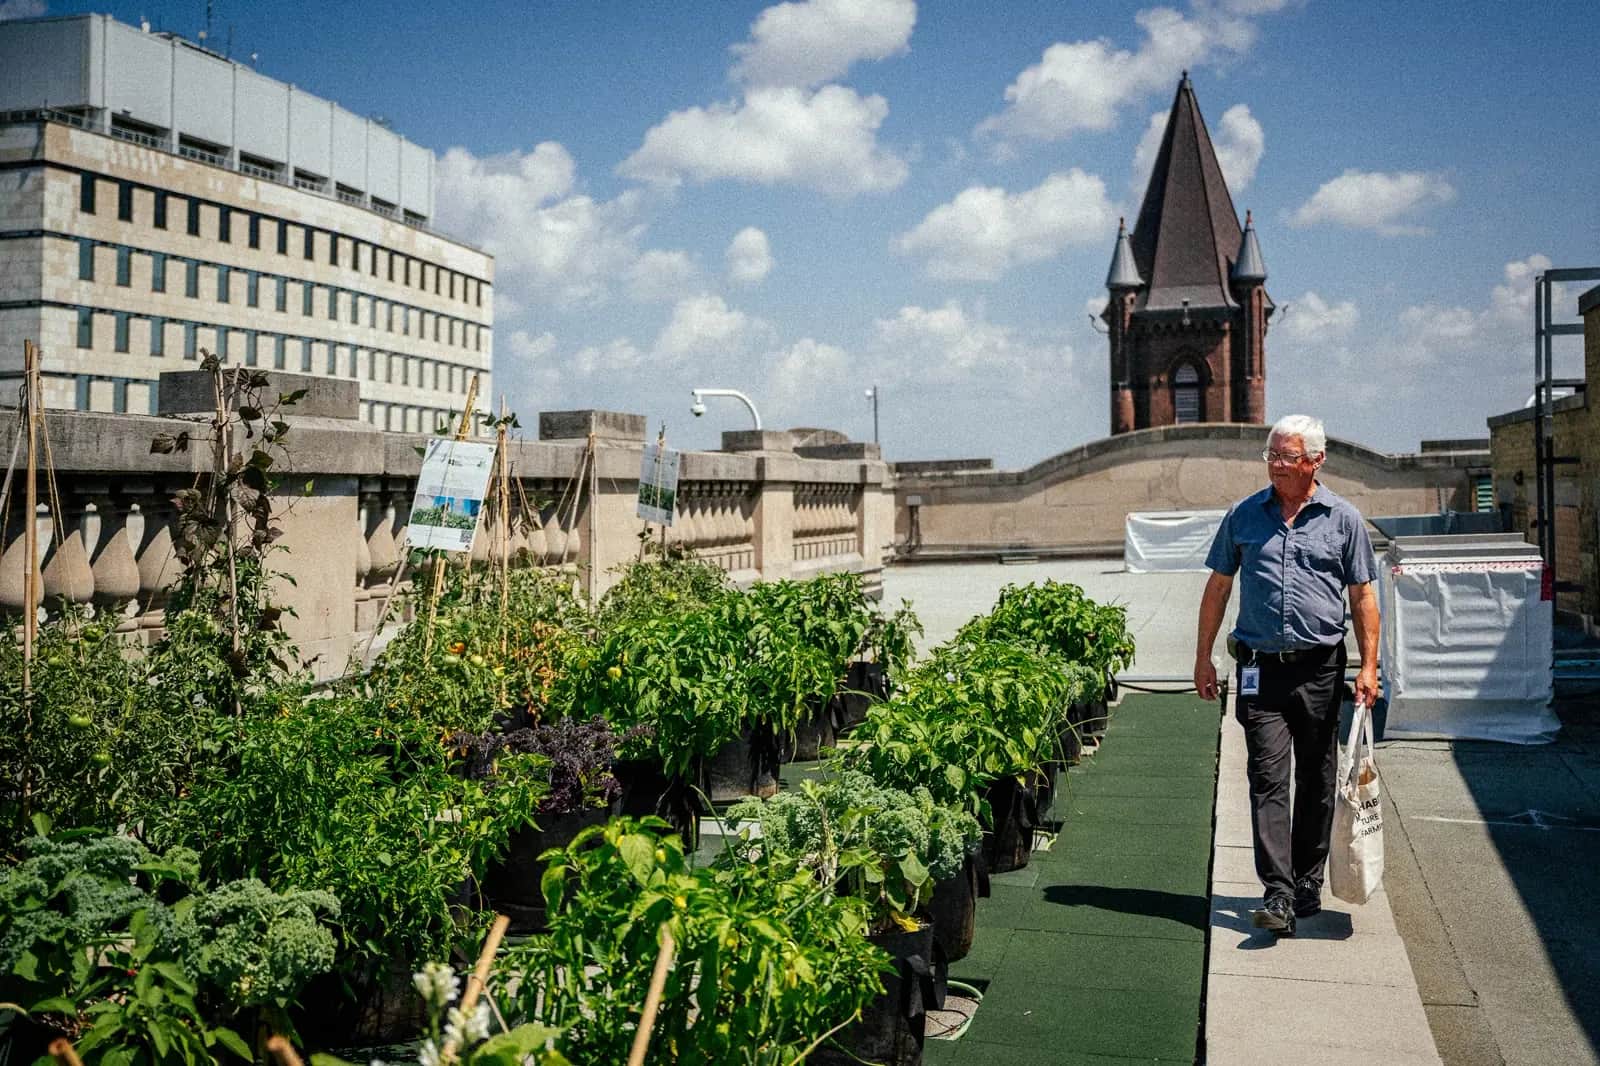
The reason this matters is structural. GRESB rewards evidence, not intentions. A policy statement earns a fraction of the points that a policy statement backed by an implemented, measurable program earns. An on-site farm is an implemented program by definition: it occupies a defined area, runs on a documented schedule, yields harvest data, and hosts people. That converts a "soft" ESG ambition into the kind of auditable artifact GRESB's validation process is designed to credit. Understanding how on-site urban farms work operationally is the first step to mapping them onto the assessment.
Which GRESB indicators does an urban farm support in GRESB sustainability reporting?
An urban farm most directly supports GRESB's biodiversity and habitat, health and wellbeing, and stakeholder-engagement indicators, because each one rewards a documented, on-asset program of exactly the kind a farm provides. Rather than spreading thin influence across the whole assessment, a farm concentrates strong evidence in a handful of criteria — which is precisely what moves a score. The table below maps the contribution to the evidence you can actually file.
| GRESB indicator area | How an urban farm contributes | Evidence to document |
|---|---|---|
| Biodiversity & Habitat | Adds vegetated area, pollinator habitat, and native/edible plantings on otherwise inert roof or ground space | Site plan with farm footprint (m²/ft²), species/crop list, pollinator-habitat notes, before/after photos |
| Health & Wellbeing (Social) | Provides green amenity, fresh produce, and access to nature for occupants | Programming calendar, tenant-participation counts, produce-donation or distribution records |
| Stakeholder / Tenant Engagement | Hosts workshops, harvest events, and educational sessions that engage occupants and community | Event logs, attendance sheets, photos, tenant-survey or feedback results |
| Community Impact / Social Value | Donates surplus produce, partners with local food programs, creates local green jobs | Donation receipts (kg/lbs), partner agreements, staffing records |
| Nature-based Solutions / Climate Adaptation | Vegetation supports stormwater management, urban heat mitigation, and on-site adaptation | Coverage area, substrate depth, integration notes with building systems |
Two cautions keep this credible. First, GRESB does not award points for "having a garden" as a line item — points flow through the indicators above when you supply the evidence. Second, the magnitude of any single farm's score impact depends on portfolio context, asset type, and which indicators were previously weak; a farm typically lifts the indicators it touches rather than the entire score in isolation. Treat it as a high-evidence contributor to several criteria, not a silver bullet.
How to document farm contributions for the assessment
Document farm contributions by capturing evidence continuously throughout the reporting year, not by reconstructing it at submission time — GRESB credits artifacts that are dated, quantified, and verifiable. The single most common reason a strong sustainability program underperforms in the assessment is thin documentation, so build the paper trail as the season runs. Use this checklist as the operating standard for an on-site farm tied to GRESB sustainability reporting.
Farm-to-GRESB documentation checklist
- Footprint & design: site plan showing farm area in m²/ft², location, and substrate or growing-system type.
- Biodiversity record: crop and plant species list, any native or pollinator plantings, and habitat features installed.
- Programming calendar: dated schedule of workshops, harvest days, and educational sessions held on site.
- Engagement metrics: attendance counts per event, tenant-participation totals, and survey or feedback results.
- Yield & distribution: harvest weights by season and records of where produce went (tenant distribution, donation, café).
- Social value: donation receipts in kg/lbs, local-partner agreements, and any jobs created or supplied.
- Visual evidence: date-stamped before/after and in-season photography of the installation and events.
- Operating partner: the service agreement and maintenance logs from your farm provider, which corroborate that the program ran as described.
A professional operator should hand you most of this as a matter of course. Across Microhabitat's installations in North America and Europe, the harvest logs, programming records and photo documentation generated through routine operation are the same artifacts that feed an ESG submission — which is why scoping the farm with reporting in mind from day one (covered below) saves significant effort at assessment time.
What credible year-over-year improvement looks like
Credible year-over-year improvement in GRESB shows up as documented progression on specific indicators — more engagement events, larger vegetated area, higher participation, fuller records — not as an unexplained jump in the headline score. Because GRESB benchmarks you against peers and weights consistency, the assessment rewards a believable trajectory backed by data over a single dramatic claim. A farm supports this well precisely because its outputs grow and accumulate: year two has a full season of yield data, a richer programming calendar, and trend lines that year one could not show.
Set the improvement narrative deliberately. In the first reporting year, the farm establishes baseline evidence: footprint, species, the inaugural set of events. In subsequent years, the story becomes change — expanded coverage, more workshops, higher tenant participation, growing donation volumes — which is exactly the directional progress GRESB's scoring favors. This evidence also compounds beyond GRESB into adjacent disclosures; the biodiversity and habitat data you collect feeds directly into CSRD biodiversity reporting and other nature-based-solutions frameworks, so a single farm program services several reporting obligations at once — one strand of a broader green building certifications strategy. Avoid inflating claims: GRESB validates submissions, and unsupported assertions cost more in credibility than they gain in points.
Scoping an on-site farm for ESG reporting
Scope an on-site farm for ESG reporting by designing for evidence from the outset — choosing size, programming, and a reporting cadence that map cleanly onto the GRESB indicators you intend to support. The farms that score best are not the largest; they are the ones whose data is captured, dated, and aligned to the assessment. The roles and cost structure below help frame a scoping conversation with finance and operations.
| Element | What to define up front | Why it matters for GRESB |
|---|---|---|
| Size & location | Vegetated area and siting on roof or grounds | Sets the biodiversity/footprint evidence and coverage figures |
| Programming plan | Number and type of tenant events per year | Drives engagement and social-value indicators |
| Operating partner | Who installs, maintains, and reports | Ensures continuous, validation-ready documentation |
| Reporting cadence | How yield, attendance, and donation data are logged | Makes year-over-year improvement defensible |
| Budget owner | Capex vs. opex split and accountable team | Aligns the program to a reporting and ROI narrative |
The strongest scoping cases pair the ESG score with a financial story, since most property teams must justify the spend on more than one axis — our analysis of rooftop garden ROI for corporate buildings covers how the same installation supports tenant attraction, retention, and brand value alongside the assessment points. Build the reporting requirements into the brief, choose an operator that delivers documentation as a deliverable, and the GRESB contribution becomes a byproduct of running the farm well — not a scramble at submission. For the authoritative methodology, the assessment structure, and current indicator definitions, consult the GRESB Real Estate Assessment directly before finalizing your reporting approach.
For property teams, on-site farms are a practical lever for urban farming in commercial real estate.
Ready to turn an on-site farm into documented GRESB evidence? Book an ESG consultation with Microhabitat to scope a farm built for your reporting cycle.
Already have green space on site? See which of the 17 certification reports your building qualifies for — eight questions, no account needed.