ESG-Aligned Urban Farming: Complete Guide
The complete guide to ESG urban farming: how on-site farms support GRESB, LEED v5, WELL, CSRD and TNFD reporting across your commercial property portfolio.
Quick answer: ESG urban farming uses on-site food production to generate documented, auditable evidence for environmental, social and governance reporting frameworks. For property owners it supports biodiversity, social-value and stakeholder indicators across GRESB, LEED v5, WELL, CSRD and TNFD — turning unused roof and ground space into reportable, benchmarkable ESG performance instead of a sustainability footnote.
ESG urban farming has moved from a tenant amenity to a reporting asset. As disclosure regimes tighten across North America and Europe, sustainability and asset-management teams need physical, on-property interventions that produce hard evidence — not pledges. An on-site farm is one of the few capital-light installations that touches all three ESG pillars at once: it adds measurable green space and biodiversity (E), creates programmable tenant and community engagement (S), and feeds documented metrics into the governance and disclosure process (G). This guide explains what counts, which frameworks recognise it, how to document it defensibly, and how to start. It is the hub for our deeper write-ups on each framework; jump to the section you need below.
On this page: What it means · Frameworks supported · Environmental indicators · Social & governance value · Documentation & benchmarking · Getting started

What ESG-aligned urban farming means for property owners
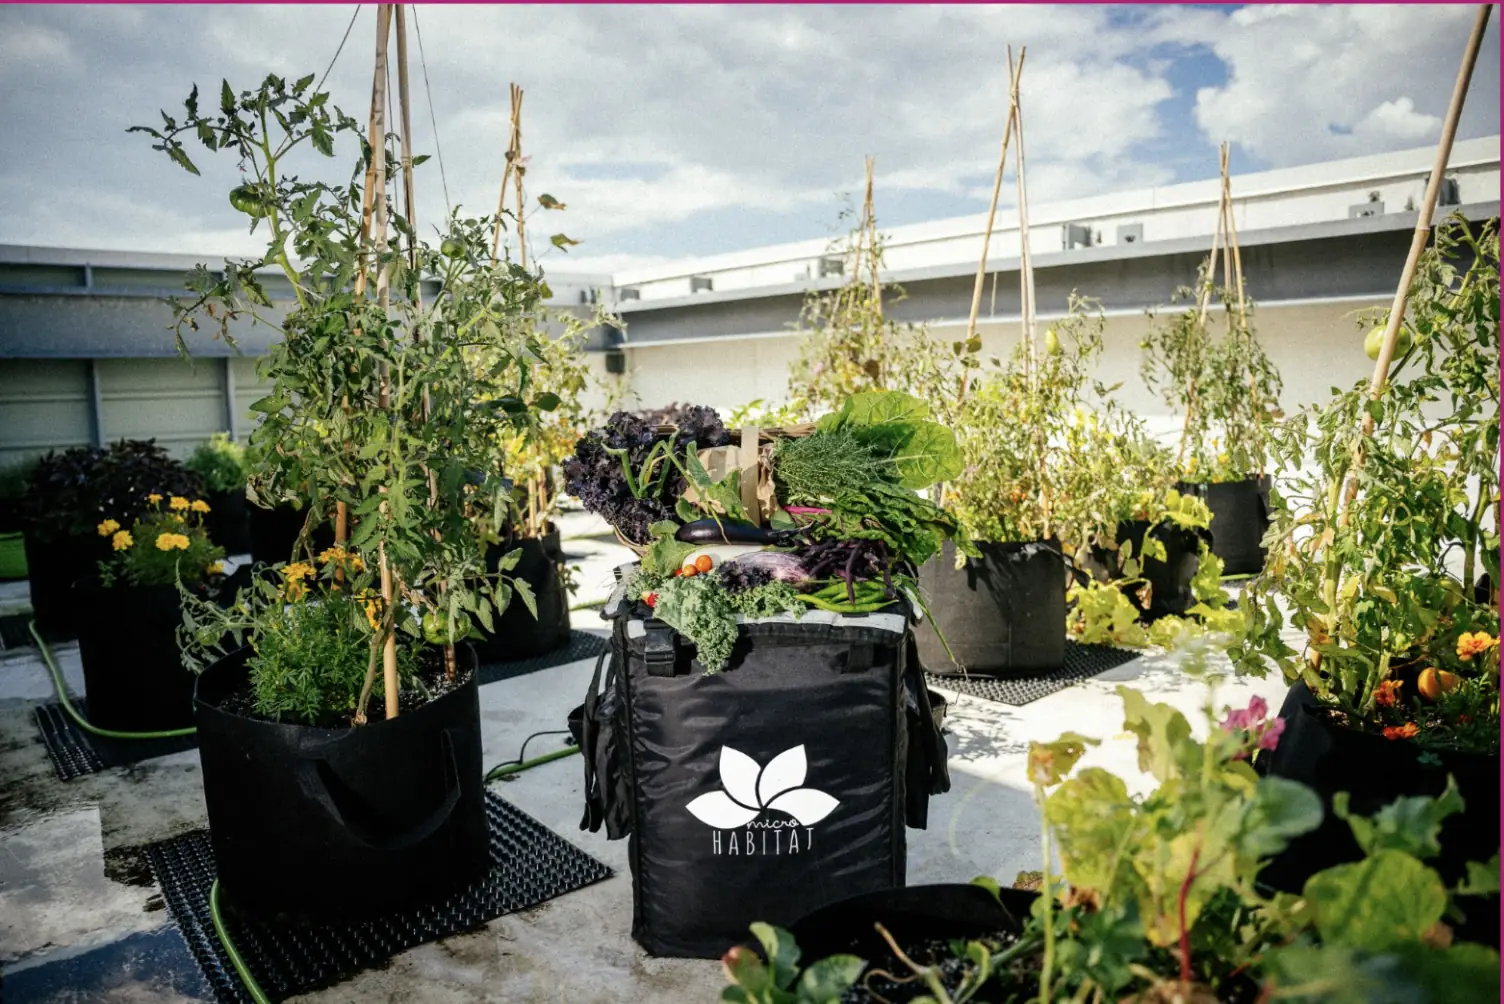
ESG-aligned urban farming means operating an on-site farm specifically so its outputs feed your environmental, social and governance disclosures with traceable data. The distinction is deliberate: a planter box is landscaping, but a managed farm with logged inputs, yields, species counts, engagement events and waste diversion is a data source. For a property owner, the unit of value is not the lettuce — it is the audit-ready record that the lettuce was grown on-site, by or with tenants, on land that was previously sealed or unused, and that the activity advanced a named indicator in a recognised framework.
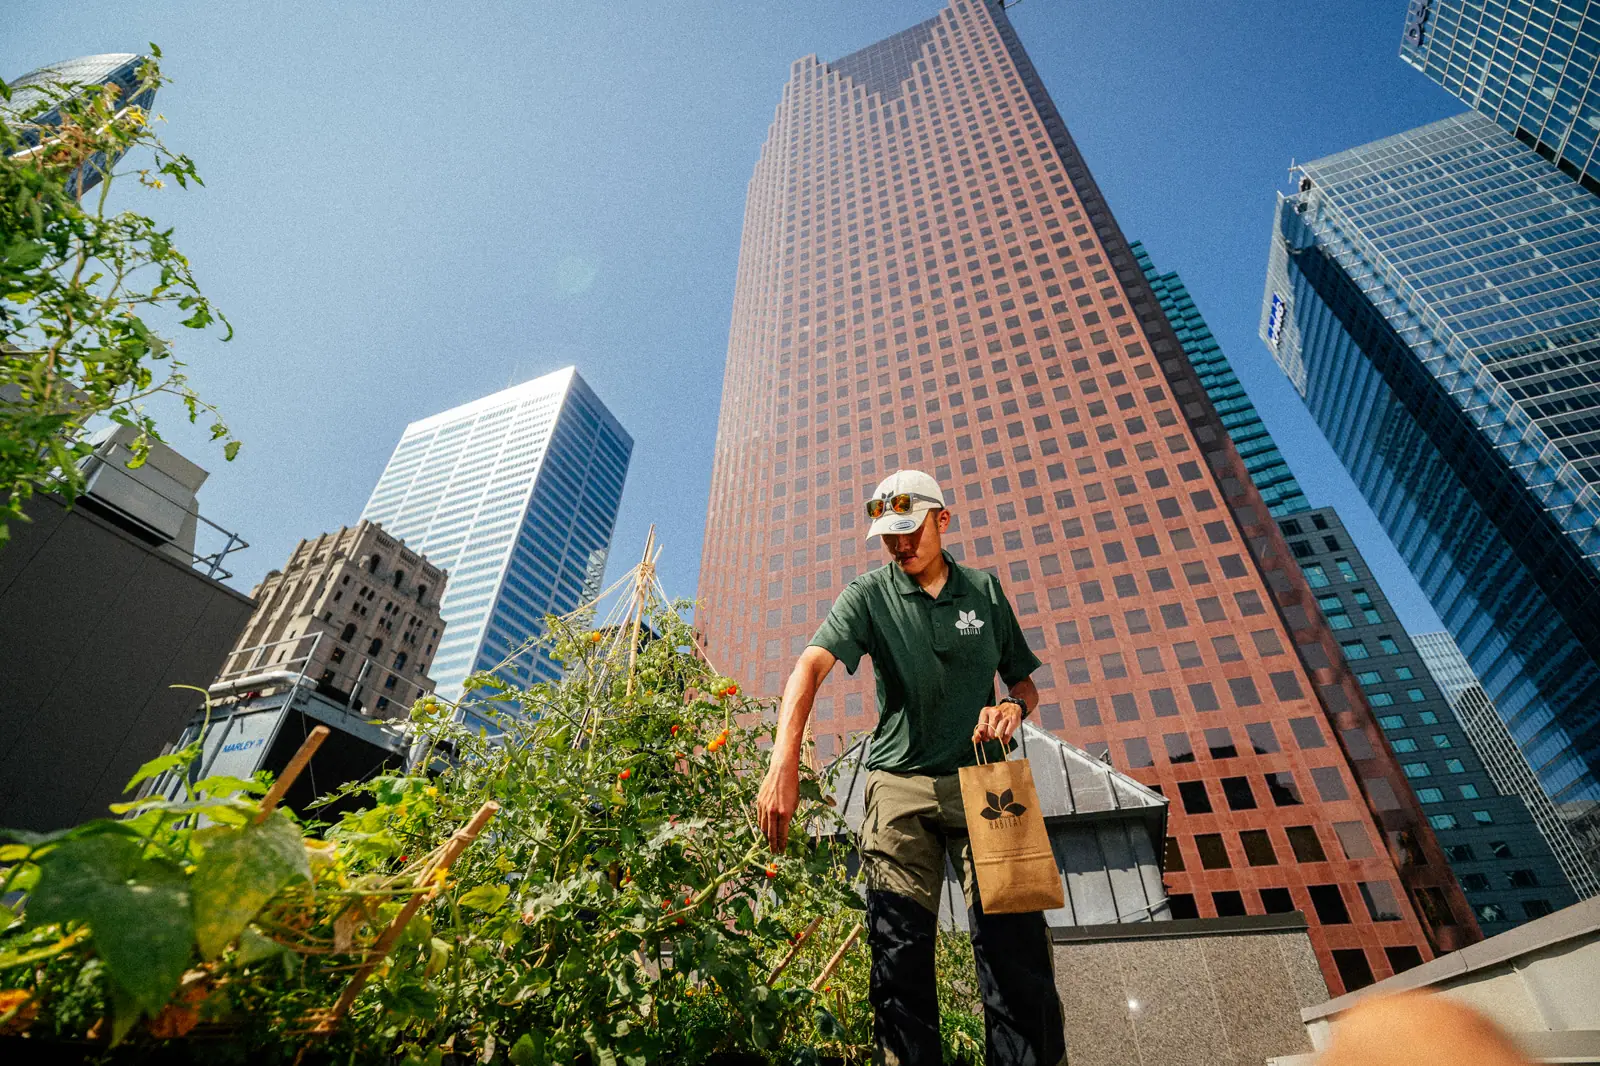
This reframing matters because ESG reporting in real estate has shifted from narrative to evidence. Reviewers, investors and regulators increasingly ask for quantitative, year-over-year, independently verifiable data. An urban farm fits because it is permanent, on-balance-sheet, and continuously generating fresh measurements — square metres greened, kilograms harvested, biodiversity observations, participation rates, organic waste composted on-site. Across Microhabitat's installations in North America and Europe, that record is what asset and sustainability teams actually submit into their frameworks. To see how a working farm is structured and operated on a commercial site, start with our overview of ESG urban farming installations, then return here for the framework detail.
Which ESG frameworks does an urban farm support?
An urban farm contributes to GRESB, LEED v5, WELL v2, the EU's CSRD/ESRS, and the TNFD nature-disclosure framework, because each rewards green space, biodiversity, occupant health, community impact or nature-positive action — all of which an on-site farm produces. No single farm "certifies" a building on its own; it supplies evidence and points toward specific indicators or credits that contribute to a score or disclosure. The table below maps the major frameworks to the indicators an on-site farm most directly supports.
| Framework | Type / scope | Indicators an urban farm supports | What it produces |
|---|---|---|---|
| GRESB | Real-estate ESG benchmark (investor-facing) | Building Certifications, biodiversity & habitat, stakeholder engagement, social factors | Year-over-year data points and narrative evidence toward the GRESB score |
| LEED v5 | Green-building rating (USGBC) | Sites / open space, biodiversity, resilient & equitable communities | Documentation supporting site- and community-related credits |
| WELL v2 | Health & wellbeing standard (IWBI) | Nourishment, Mind, Community concepts | Evidence for healthy-food access and occupant-engagement features |
| CSRD / ESRS | EU mandatory sustainability disclosure | ESRS E4 (biodiversity & ecosystems), S-pillar community metrics | Quantitative datapoints for double-materiality disclosure |
| TNFD | Nature-related financial disclosure | Dependencies & impacts on nature, location-based metrics | Site-level nature data for the LEAP assessment |
Used together, these frameworks reward the same underlying physical asset from different angles — which is why one well-documented farm can return value across an entire reporting stack rather than a single line. Each row above has its own deep guide; the sections that follow explain the environmental, social and governance mechanics behind them.
What environmental indicators does an urban farm improve?
An urban farm improves four environmental indicators property teams report on most: green space and land use, biodiversity, on-site organic-waste diversion, and stormwater/heat performance. These map directly onto the environmental criteria inside GRESB, LEED v5, the ESRS E4 biodiversity standard and the impact side of a TNFD assessment. Critically, each is measurable on-site, which is what converts an environmental benefit into a reportable datapoint rather than a claim.
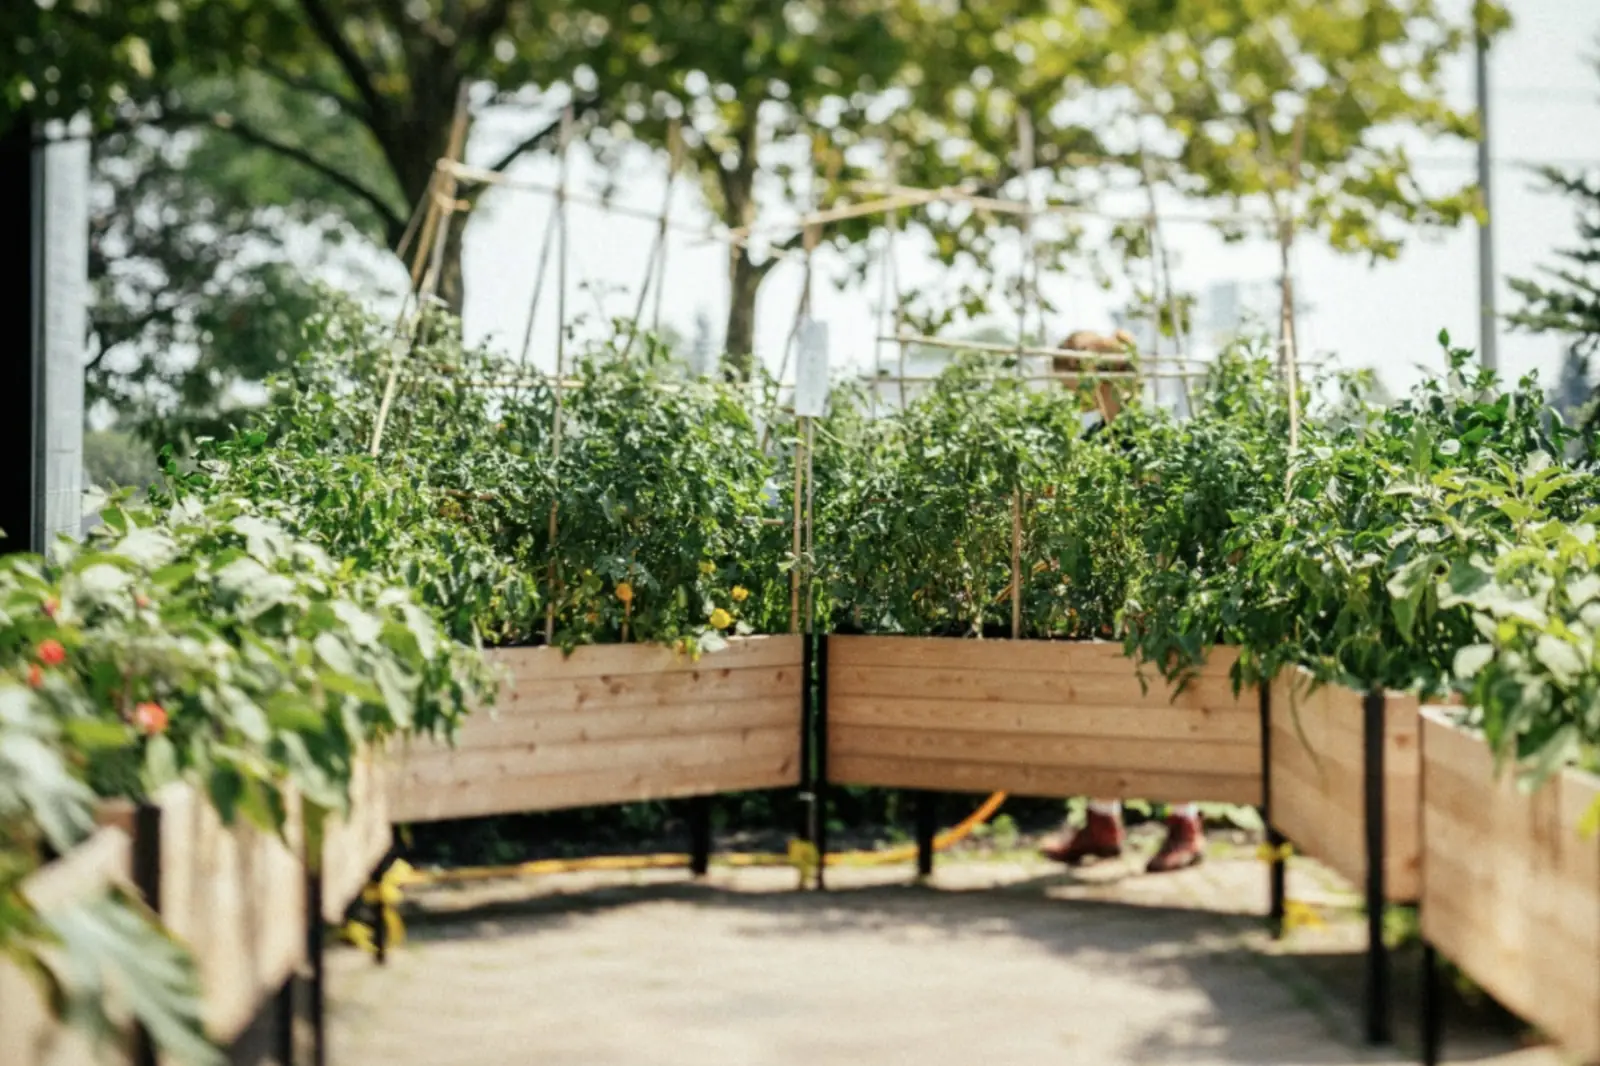
- Green space and land use. A farm converts sealed or unused roof and ground area into productive, vegetated space — recorded in square metres and tracked year over year. This is the cleanest input to open-space and land-use indicators.
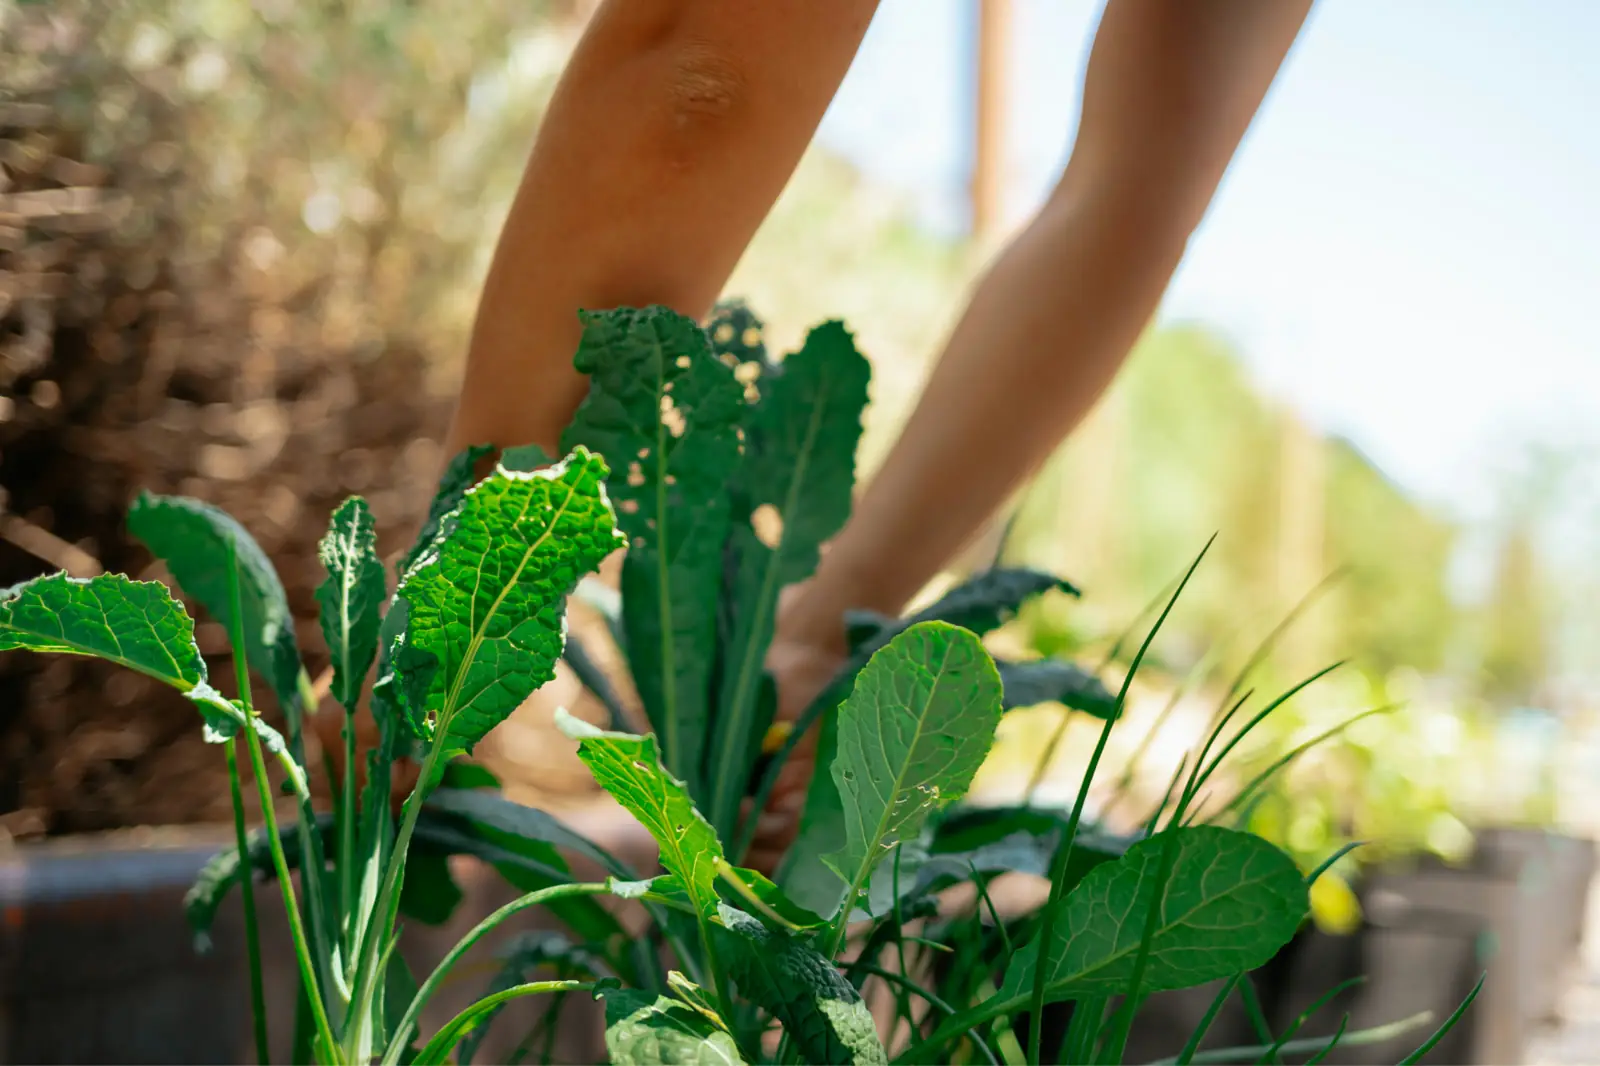
- Biodiversity and habitat. Crop diversity plus pollinator-supporting planting creates measurable habitat. Logged species and pollinator observations feed biodiversity criteria in GRESB and ESRS E4, and underpin a credible CSRD biodiversity reporting narrative for assets in scope of EU rules.
- Circularity and waste. On-site composting diverts organic waste from landfill and closes a nutrient loop, generating a quantifiable diversion figure for circular-economy and waste indicators.
- Climate resilience. Vegetated roofs reduce stormwater runoff and the urban heat-island effect — recognised benefits of green infrastructure documented by the US EPA. These support resilience and adaptation criteria across multiple frameworks.
On the carbon side, the honest framing is that a farm's primary climate value is qualitative and indirect — local food, avoided transport, soil and vegetation — rather than a large tonnage offset. Where it becomes genuinely material to disclosure is in the value-chain conversation: on-site growing and organic-waste diversion are legitimate inputs to a Scope 3 nature-based solutions narrative for a building. Treat the farm as a biodiversity-and-circularity asset first, and a carbon asset second.
How does urban farming support social and governance reporting?
Urban farming supports the social pillar by creating structured, measurable engagement between a building and the people who use it, and supports governance by feeding that activity into the disclosure and stakeholder-management process. The "S" and "G" of ESG are often the hardest to evidence because they resist easy quantification — and this is exactly where a programmed farm outperforms passive green features, because every workshop, harvest event and donation can be counted, dated and attributed.
On the social side, an on-site farm delivers tenant wellbeing, community building and food access. Programmed activities — planting days, harvest sessions, educational workshops — produce participation data (events held, attendees, hours) that supports the Community and Mind concepts in WELL v2 and the social factors GRESB rewards. Harvested produce donated to local food banks creates a documented community-benefit and food-security metric. Healthy-food access on-site is precisely what the WELL v2 nourishment feature is designed to recognise, and what the International WELL Building Institute frames as occupant health. For occupiers chasing talent and retention, a visible, hands-on amenity also strengthens the human-capital story.
On the governance side, the value is process and traceability. A farm run by a specialist partner comes with logged operations, standardised reporting and a clear chain of evidence — the data discipline that governance reviewers look for. That same record flows into investor-facing GRESB sustainability reporting, where consistent, verifiable, year-over-year data is what moves a score. Good governance here is simply the ability to show who did what, when, and with what result — and to repeat it reliably across a portfolio.
How do you document and benchmark an urban farm's ESG contribution?
You document an urban farm's ESG contribution by capturing standardised metrics at the point of activity, mapping each metric to the specific framework indicator it serves, and reporting it on the same year-over-year basis your other ESG data uses. Documentation is the step that separates a real reporting asset from a feel-good amenity: an undocumented farm contributes nothing to a score, while a well-documented one contributes across several. The benchmarking principle is consistency — the same metrics, the same method, every reporting cycle — so reviewers can see a trend, not a snapshot.
Use this checklist as the minimum documentation set for an ESG-aligned farm:
- Area greened — square metres of productive growing space converted from unused/sealed surface (land-use, open-space indicators).
- Yield — kilograms harvested per season, by crop (productivity, food-access evidence).
- Biodiversity log — crop species count plus pollinator/wildlife observations, dated (GRESB biodiversity, ESRS E4, TNFD impact data).
- Waste diverted — kilograms of organic waste composted on-site (circularity, waste indicators).
- Engagement record — number of events, attendees and participation hours (WELL Community/Mind, GRESB social).
- Community contribution — kilograms of produce donated and recipient organisations (social-value, food-security metrics).
- Photographic & narrative evidence — dated imagery and a short methodology note for audit and certification submissions.
- Framework mapping — a one-page crosswalk linking each metric above to the GRESB / LEED / WELL / CSRD / TNFD indicator it supports.
The framework-mapping line is the highest-leverage item: it is what turns a pile of farm data into a submission your reviewer or auditor can accept directly. For portfolio owners, standardising this set across assets also makes the data comparable building-to-building — the foundation of credible internal benchmarking and of a defensible TNFD nature disclosure at the location level. A specialist operator should provide this reporting as part of the service rather than leaving it to the property team to reconstruct after the fact.
How do you get started with an ESG-aligned installation?
You get started by matching a site to a framework goal, validating the space, and engaging a specialist operator who delivers both the farm and the reporting. Treat it as a reporting project with a physical deliverable, not a landscaping job — the sequence below keeps the installation aligned to the indicators you actually need to move.
- Define the reporting objective. Decide which framework(s) and indicators matter most for the asset — a GRESB submission, a LEED v5 credit, a WELL feature, a CSRD/ESRS datapoint, or a TNFD location assessment. This determines what to measure from day one. The LEED v5 sites credit path, for example, has different documentation needs than a GRESB biodiversity narrative.
- Assess the site. Confirm load-bearing capacity (for rooftops), sun exposure, water access and safe egress. A specialist conducts this feasibility review before any commitment.
- Engage a specialist operator. A turnkey partner handles design, installation, year-round maintenance, tenant programming and — crucially — the ESG reporting. This removes operational burden from the property team and ensures the data is captured to a defensible standard.
- Program for the social pillar. Schedule the workshops, harvest events and donation cycles that generate engagement and community-benefit data; passive farms underperform on the "S".
- Report and benchmark. Feed the standardised metrics into your annual ESG reporting and track them year over year to show the trend reviewers reward.
Done in this order, an on-site farm starts producing reportable evidence in its first season and compounds in value each cycle as the year-over-year record builds. The hardest part is rarely the growing — it is the discipline of objective-first design and consistent measurement, which is exactly what a specialist partner exists to provide.
ESG urban farming, in short
ESG urban farming turns unused property space into a multi-pillar reporting asset that produces auditable evidence for GRESB, LEED v5, WELL, CSRD and TNFD. The environmental case (green space, biodiversity, circularity, resilience) is the most direct, the social case (engagement, food access, community benefit) is the most under-served by passive features, and the governance case (traceable, year-over-year data) is what makes the whole thing credible. The differentiator is documentation: an installation only earns its place in your disclosures when its metrics are captured, mapped to indicators, and benchmarked consistently. Get that right and one farm returns value across your entire reporting stack.
Go deeper on each framework: GRESB, LEED v5, WELL v2, BOMA BEST, CSRD, Scope 3, and TNFD.
Ready to make your space count toward your ESG goals? Request our ESG reporting framework crosswalk — a ready-to-use framework-to-metric crosswalk for documenting an on-site farm — or book an ESG consultation with the Microhabitat team.
Already have green space on site? See which of the 17 certification reports your building qualifies for — eight questions, no account needed.